OpenMusic Tutorials
Prev| Chapter 7. Breakpoint Functions| Next
Tutorial 19: Using BPFs I; Graphic representation of a series of notes
Topics
Using a BPF (Breakpoint function) to analyze melodic contour.
Key Modules Used
The Concept:
In this patch a series of values is used to produce a graphic representation
of a melody and a melody itself. The list of midics is passed to the
_lmidic_ input of a Chord-seq object to view it as a
melody, as usual, but also to the _y-points_ input of a
BPF object, where it is converted into a graph (a
contour).
The Patch:
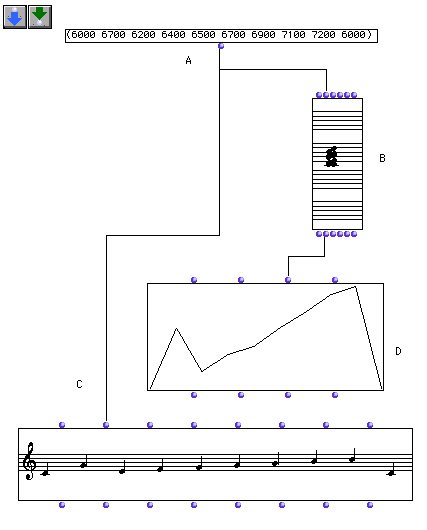
Enter some values in midicents here at (A). Remember that in midicent-notation C3 is equal to 6000, C♯3 is equal to 6100, and so forth.
The Chord box can visualise these values either as a chord or as a sequence (“order” mode). Evaluate the box and see the different types of musical notation.
The Chord-seq box receives these midicent-values and translates them into musical notation. Evaluate this box to see the musical result.
The BPF box translates the midicents into a break- point function. On a grid with x and y axes, the graph of a break-point function is a continuous line. (A break-point function can have at most one y value for each x value. In graphic terms this means that a given vertical line can only intersect the graph once. Evaluate the box to see the graphic representation of your sequence of notes.
Prev| Home| Next
—|—|—
Breakpoint Functions| Up| Tutorial 20: Using
BPFs II: Sampling a sequence of notes