| Navigation : Previous | Next |
Display Options
Contents
- Curve and Points
- View
- Background Picture
- Spline Display
Curve and Points
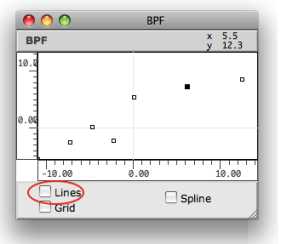
Show / Hide Points
To display or hide the points of a curve, click on or outside it.
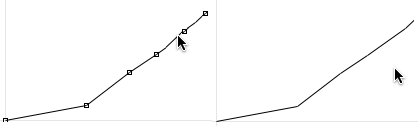
Show / Hide Line
The line option is selected by default.
To display points only, unselect this option.
Grid
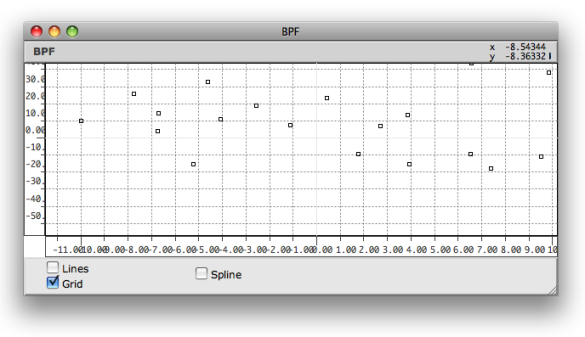
Displaying a grid in a BPF editor.
To display a grid in the editor, select the grid option.
The grid’s step is adapted automatically to the window size and to the axis scale.
Indexes
Press p to show or hide the indexes of the points. The indexes are not
ordered “chronologically”, but follow the abscissa axis order.

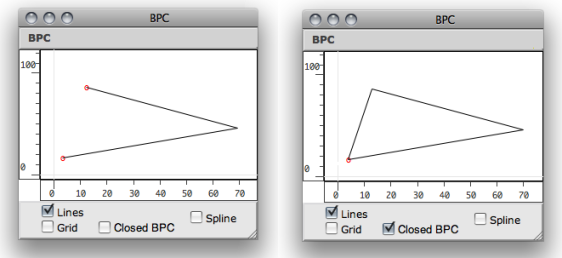
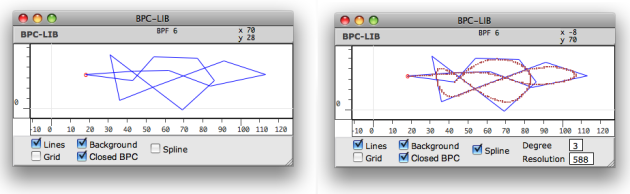
Closed BPC
BPC editors have an additional option : the Closed BPC option.
This option allows to connect the first and last point of the curve, in order to get a polyhedron.
View
Browsing the Editor
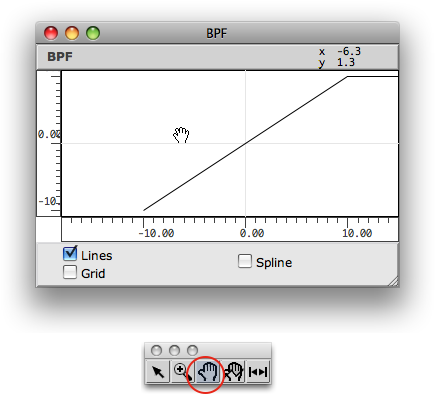
To browse the editor’s surface :
-
select the hand tool
 ,
, -
click and drag the mouse in the editor.
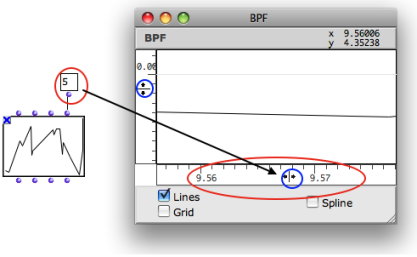
Rulers
To change the editor’s scale, click and drag the abscissa or ordinates axis.
The adjustment limits of the abscissa ruler depends on the value of the “decimals” input.
 Zoom In / Out, Resize
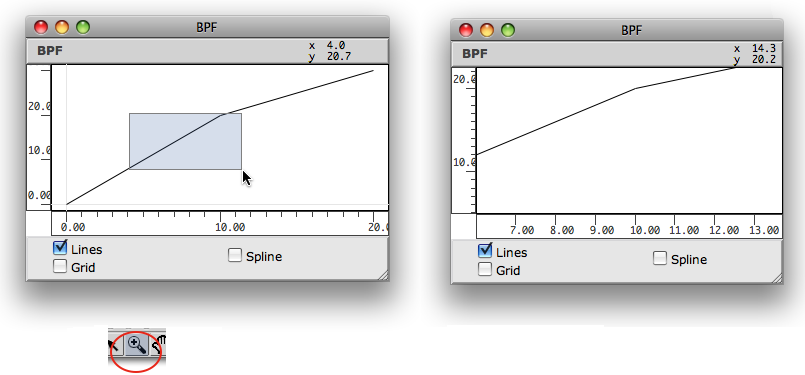
To zoom in a region of a curve :
-
select the zoom tool
 ,
, -
click and drag a region.
To fit the editor’s scale to the object size, click on the resize tool
![]() .
.
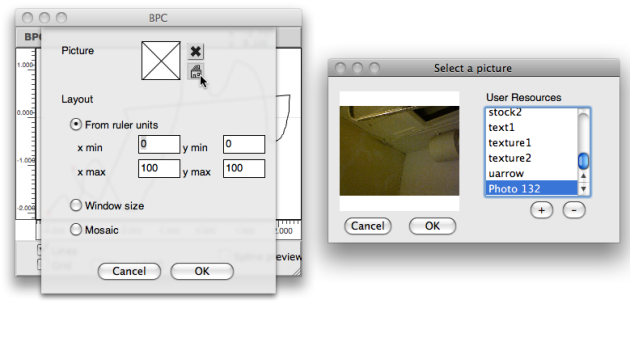
Background Picture
A picture can be associated with the BPF or BPC editors and displayed as background. To select a background picture :
-
Ctrl/ right click and and selectBackground Picturein the contextual menu -
Click on the picture icon
-
Select a picture via the dialogue window
Pictures Management:

To delete the picture, click on the small cross icon.
-
Several options are available to set the picture coordinates and size relatively to the editor scale.
-
When a background picture is attached to the editor, the resize command
 fits the editor’s scales to the picture size.
Spline Display
Spline Curves
Spline are mathematical functions defined piece-wise by polynomial interpolation. They are used for generating smoothed interpolated shapes , starting from a set of control points. Some functions in OM allow to generate spline curves starting from the points of a BPF or BPC.
 Displaying the spline of a curve.Zoom
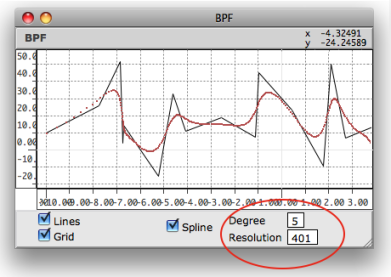
To display the preview of a spline curve computed from the BPF/BPC, check the spline display option.
Parameters
- The spline’s resolution represents the number of points in the spline preview.
- The spline’s degree determines the number of adjacent control points used for computing the spline curve points. Higher values produce smoother curves.
To modify the spline resolution or degree :
-
click on the ” Degree” or “ Resolution “ frames
-
scroll the mouse up or down to change the value.
Spline Tools in OM:
Contents :
- OpenMusic Documentation
- OM User Manual
- OpenMusic QuickStart
| Navigation : Previous | Next |